Methods
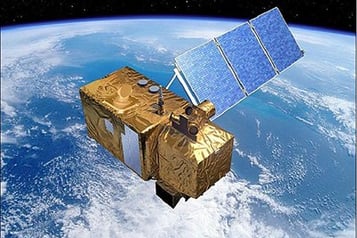
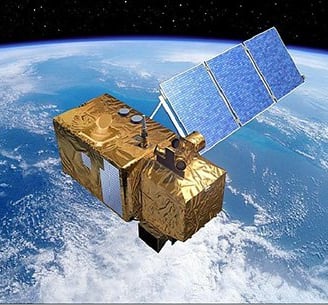
Data Collection using SENTINEL 2
Use satellites to analyze changes in coral cover and the visual impact of bleaching events on specific coral reefs, spatially and temporally
Data Analysis
Use QGIS or ENVI to process high-resolution imagery and extrapolate information on coral reefs
Comparative Analysis
Compare the impact and progression of coral bleaching by performing a change detection analysis, comparing different time periods
Health Analysis
Analyze changes in coral color from satellite imagery and with the use of indices to assess bleaching and general health
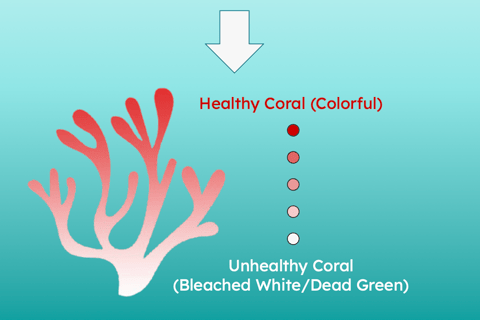
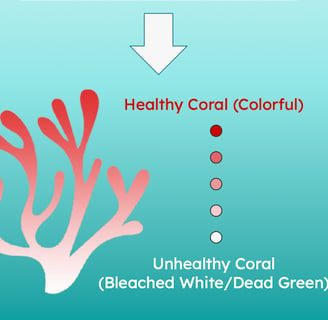
Coral Health
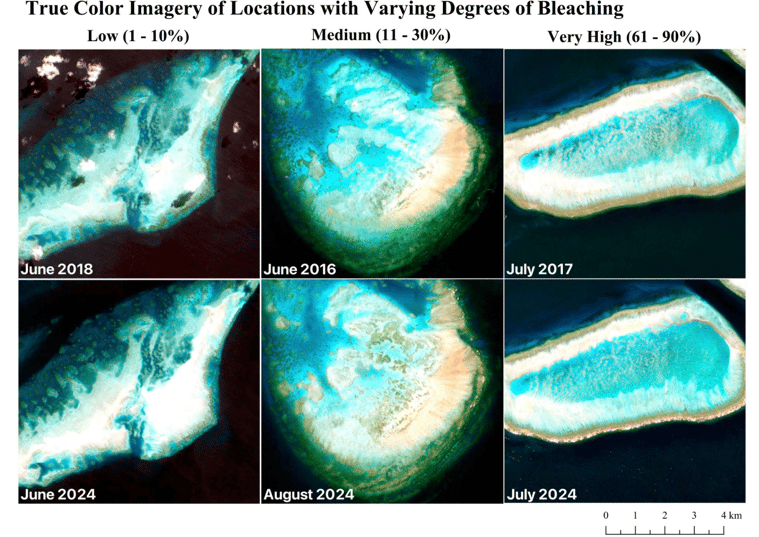
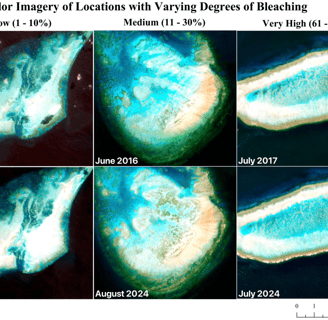
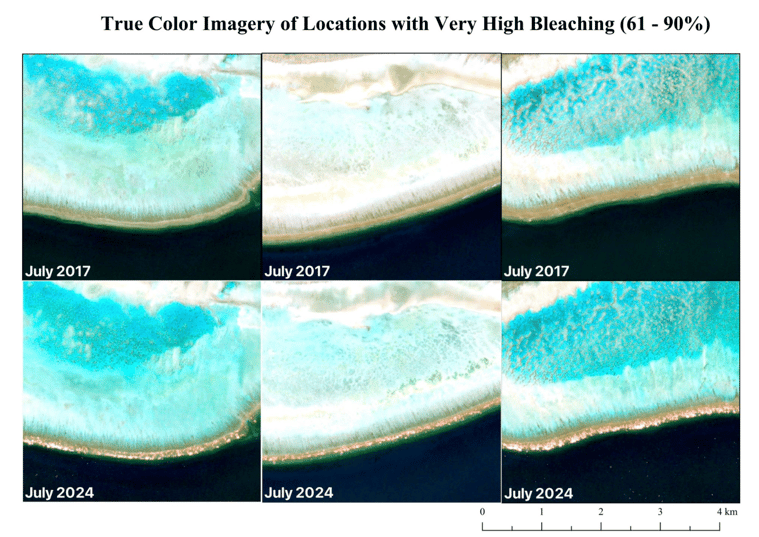
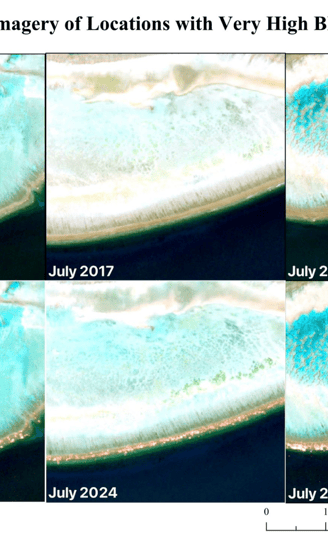
In true color, coral health can be measured by its color
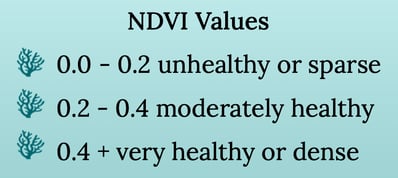
In NDVI, coral health is measured somewhat similar to other vegetation.
However, indicator values are generally lower due to zooxanthellae having lower NIR reflectance than land vegetation.
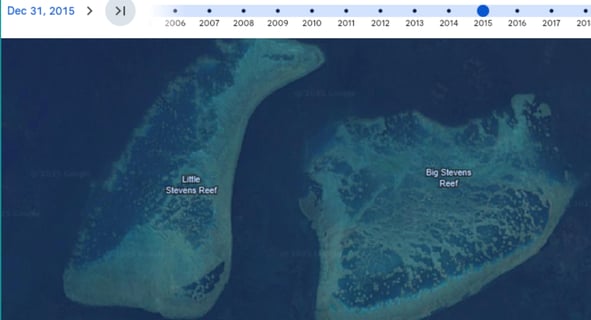
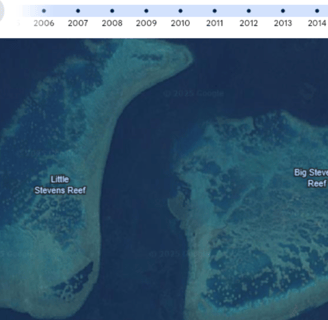
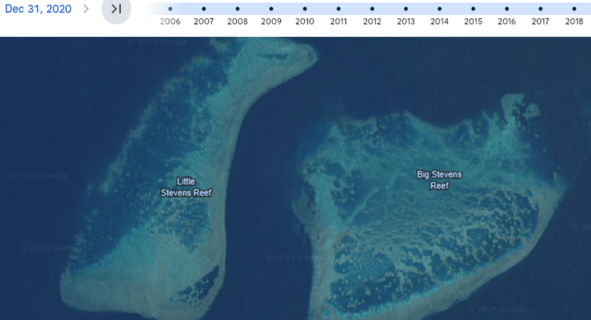
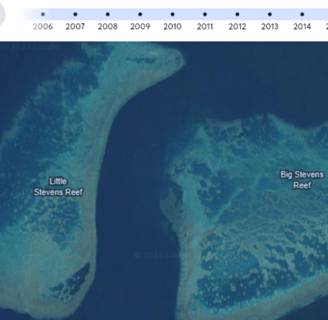
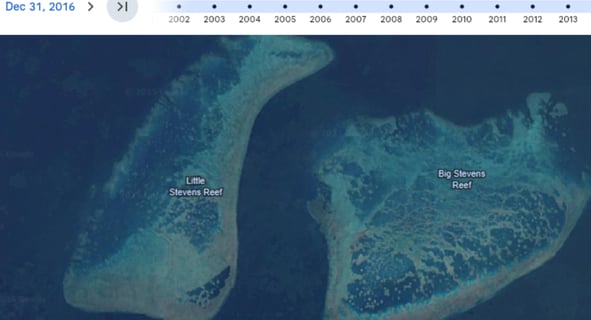
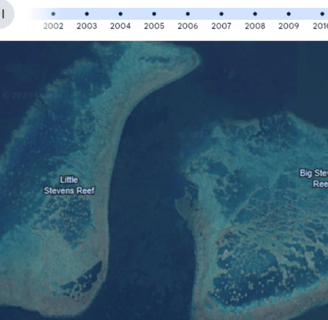
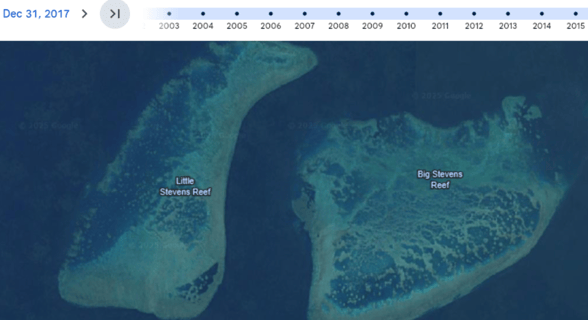
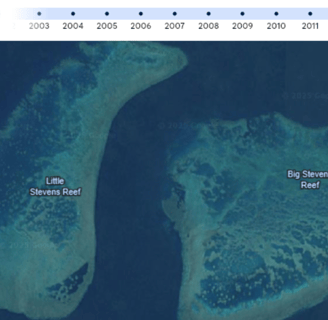
Google Earth Imagery
December 2015, before the major bleachings
December 2016, after the first bleaching
December 2017, after the second bleaching
December 2020
Results
True Color Imagery
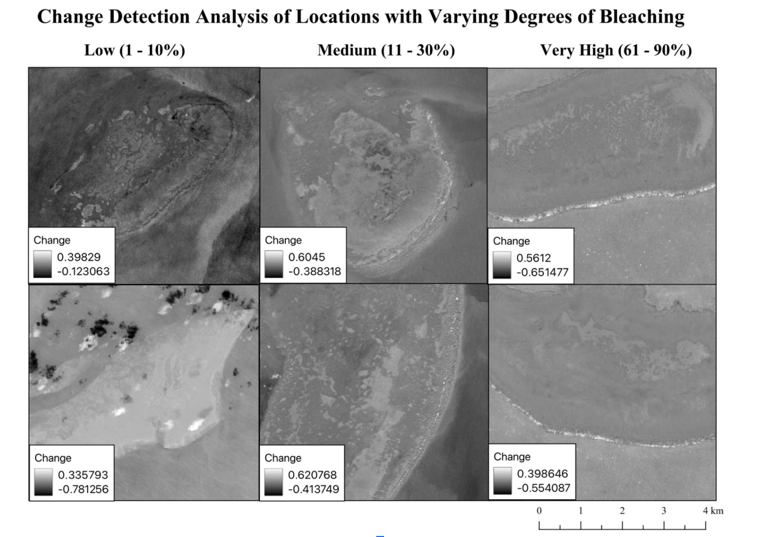
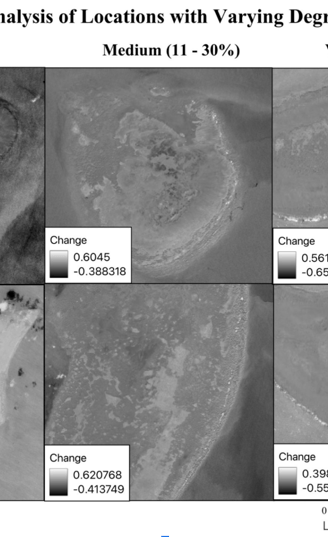
Change Detection Analysis
Supported findings from true-color image analysis
Quantitative approach for assessing the extent of bleaching
Effective for fine-scale monitoring
ENVI NVDI Results
2024
2015
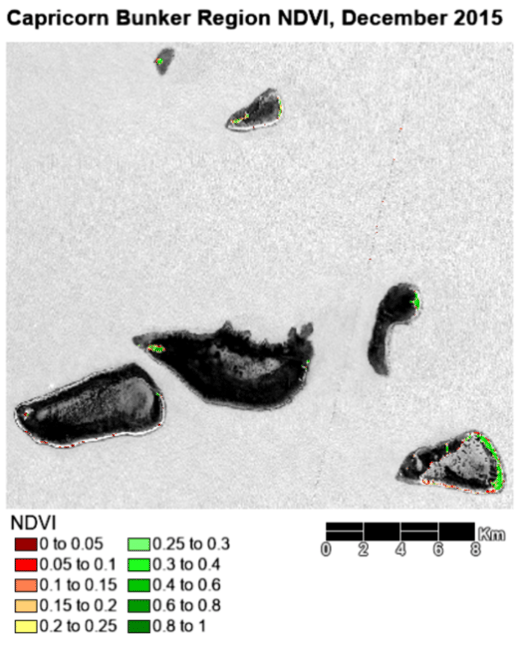
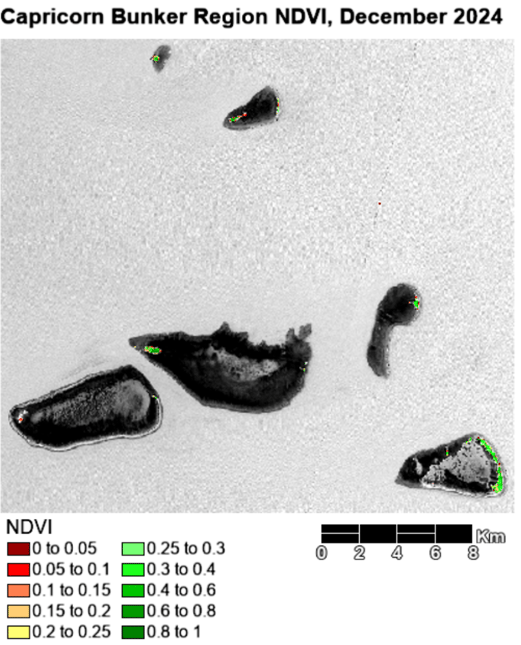
Raw NDVI Results
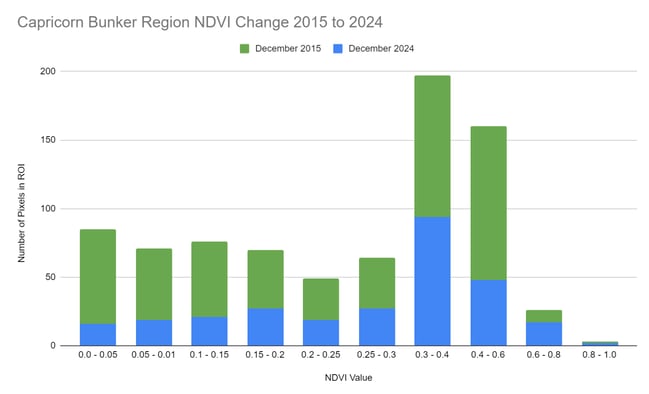

Extreme bleaching in weakened coral (80%+ lost)
~ 50% bleaching in healthy coral